The following are examples of some of the output generated. The full suite of results are included as part of the project report.
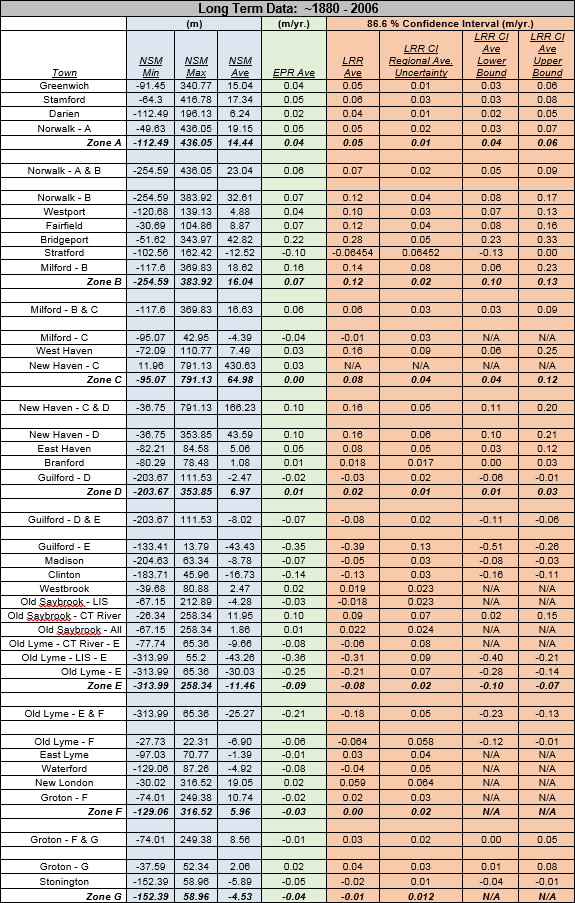
Long Term Summary Data Table:
Town: Coastal Community (also includes shoreline districts)
NSM Min: Net Shoreline Movement Minimum Value
NSM Max: Net Shoreline Movement Maximum Value
NSM Ave: Net Shoreline Movement Average Value
EPR Ave: End Point Rate Average
LRR Ave: Linear Regression Rate Average
LRR CI Regional Ave. Uncertainty: The average confidence interval corresponding to the LRR.
LRR CI Ave Lower Bound: Lower bound of the confidence interval (LLR Ave) + (LRR CI Regional Ave. Uncertainty)
LRR CI Ave Upper Bound: Upper bound of the confidence interval (LLR Ave) + (LRR CI Regional Ave. Uncertainty)
Continue to example charts.